
DNBSEQ pre-made libraries
Features
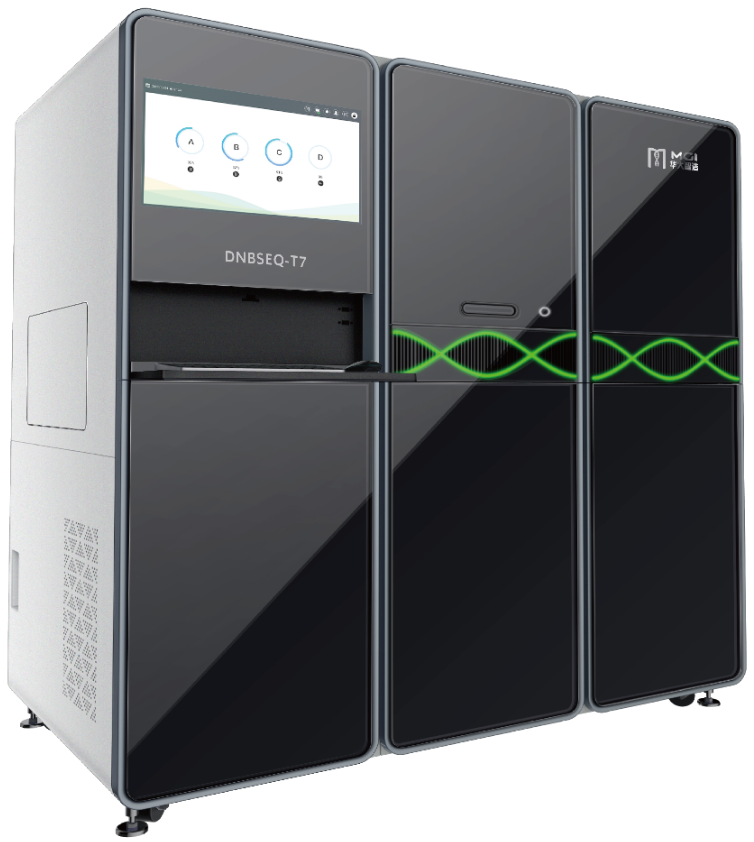
● Platform: MGI-DNB-T7
● Sequencing modes: PE150
● Transfer of Illumina libraries to MGI: enabling sequencing of high data volumes at low cost.
● Quality control of libraries before sequencing.
● Sequencing data delivery and QC: delivery of QC report and raw data in fastq format after demultiplexing and filtering Q30 reads.
Advantages
● Versatility of Sequencing services: the customer may choose to sequence by lane or amount of data.
● High data output: 1400 Gb/lane
● Delivery of sequencing QC report: with quality metrics, data accuracy and overall performance of the sequencing project.
● Mature sequencing process: with short turn-around time.
● Rigorous Quality Control: we implement strict QC requirements to guarantee the delivery of consistently high-quality results.
Sample Requirements
|
Data Amount (X) |
Concentration (qPCR/nM) |
Volume |
|
|
Partial Lane |
X ≤ 50 Gb |
≥ 2 nM |
≥ 20 μl |
|
50 Gb ≤ X < 100 Gb |
≥ 3 nM |
≥ 20 μl |
|
|
X ≥ 100 Gb |
≥ 4 nM |
≥ 20 μl |
|
|
Single Lane |
≥ 1.5 nM |
≥ 25 μl |
|
In addition to concentration and total amount, a suitable peak pattern is also required.
Service Workflow
Library QC report
A report on the quality of the library is provided before sequencing, assessing library amount, and fragmentation.
Sequencing QC report
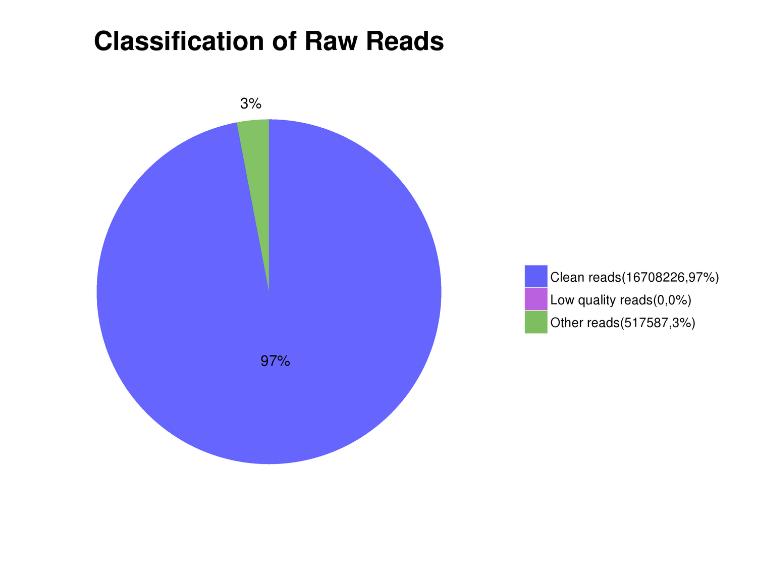
Table 1. Statistics on sequencing data.
|
Sample ID |
BMKID |
Raw reads |
Raw Data (bp) |
Clean reads (%) |
Q20(%) |
Q30(%) |
GC(%) |
|
C_01 |
BMK_01 |
22,870,120 |
6,861,036,000 |
96.48 |
99.14 |
94.85 |
36.67 |
|
C_02 |
BMK_02 |
14,717,867 |
4,415,360,100 |
96.00 |
98.95 |
93.89 |
37.08 |
Figure 1. Quality distribution along reads in each sample
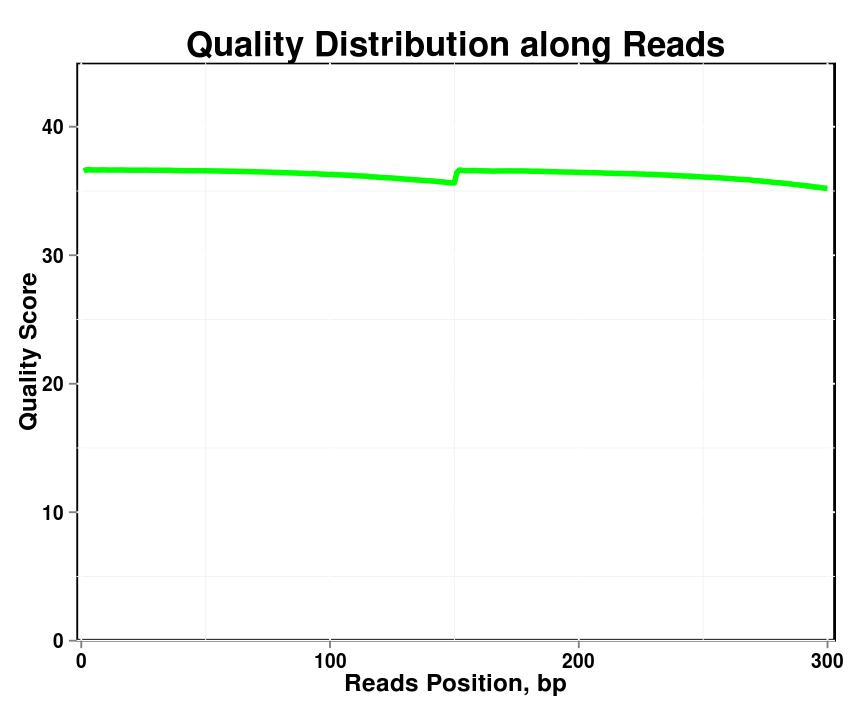
Figure 2. Base content distribution
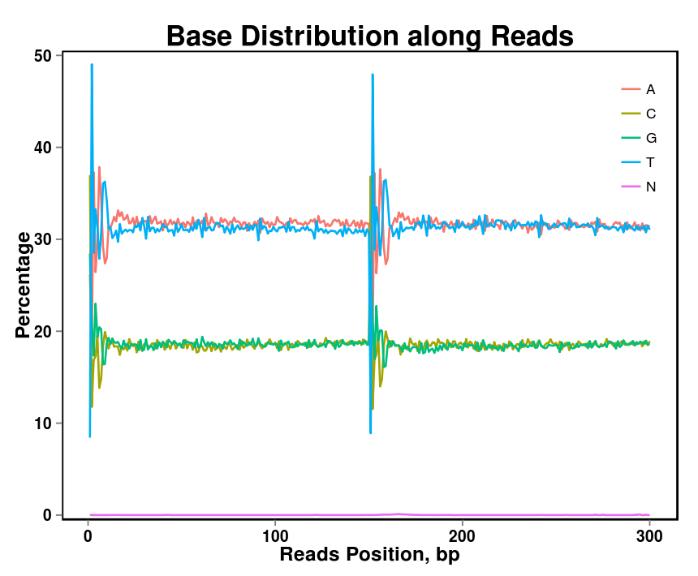
Figure 3. Distribution of read contents in sequencing data