
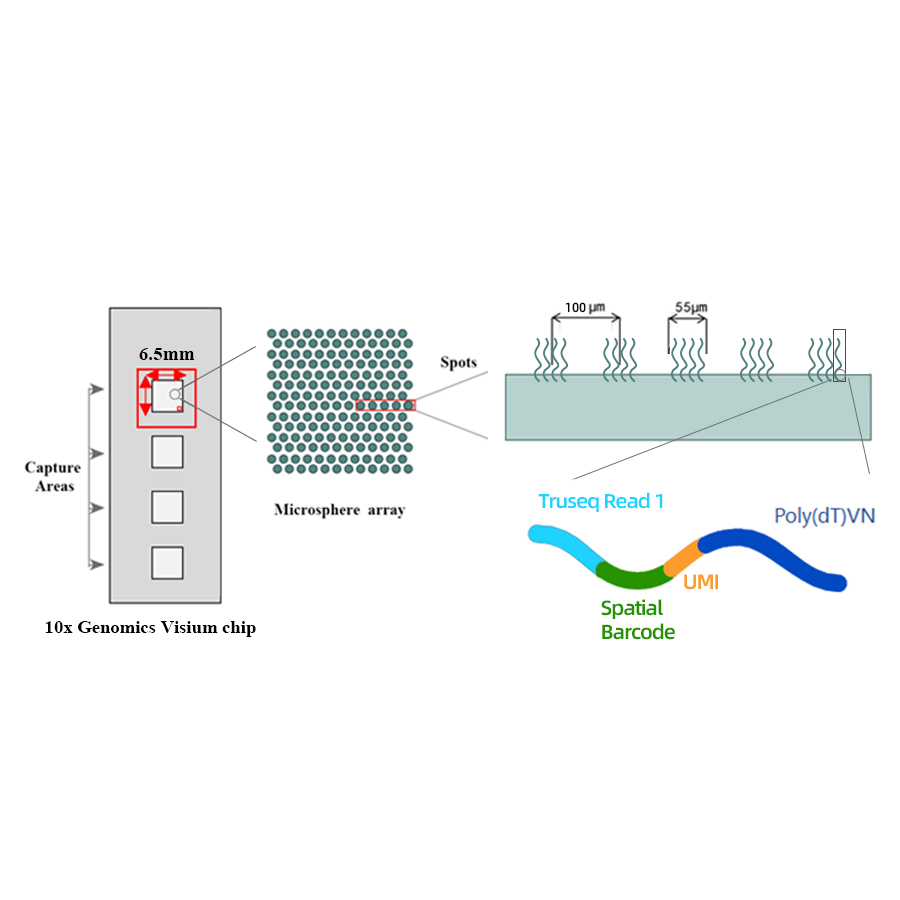
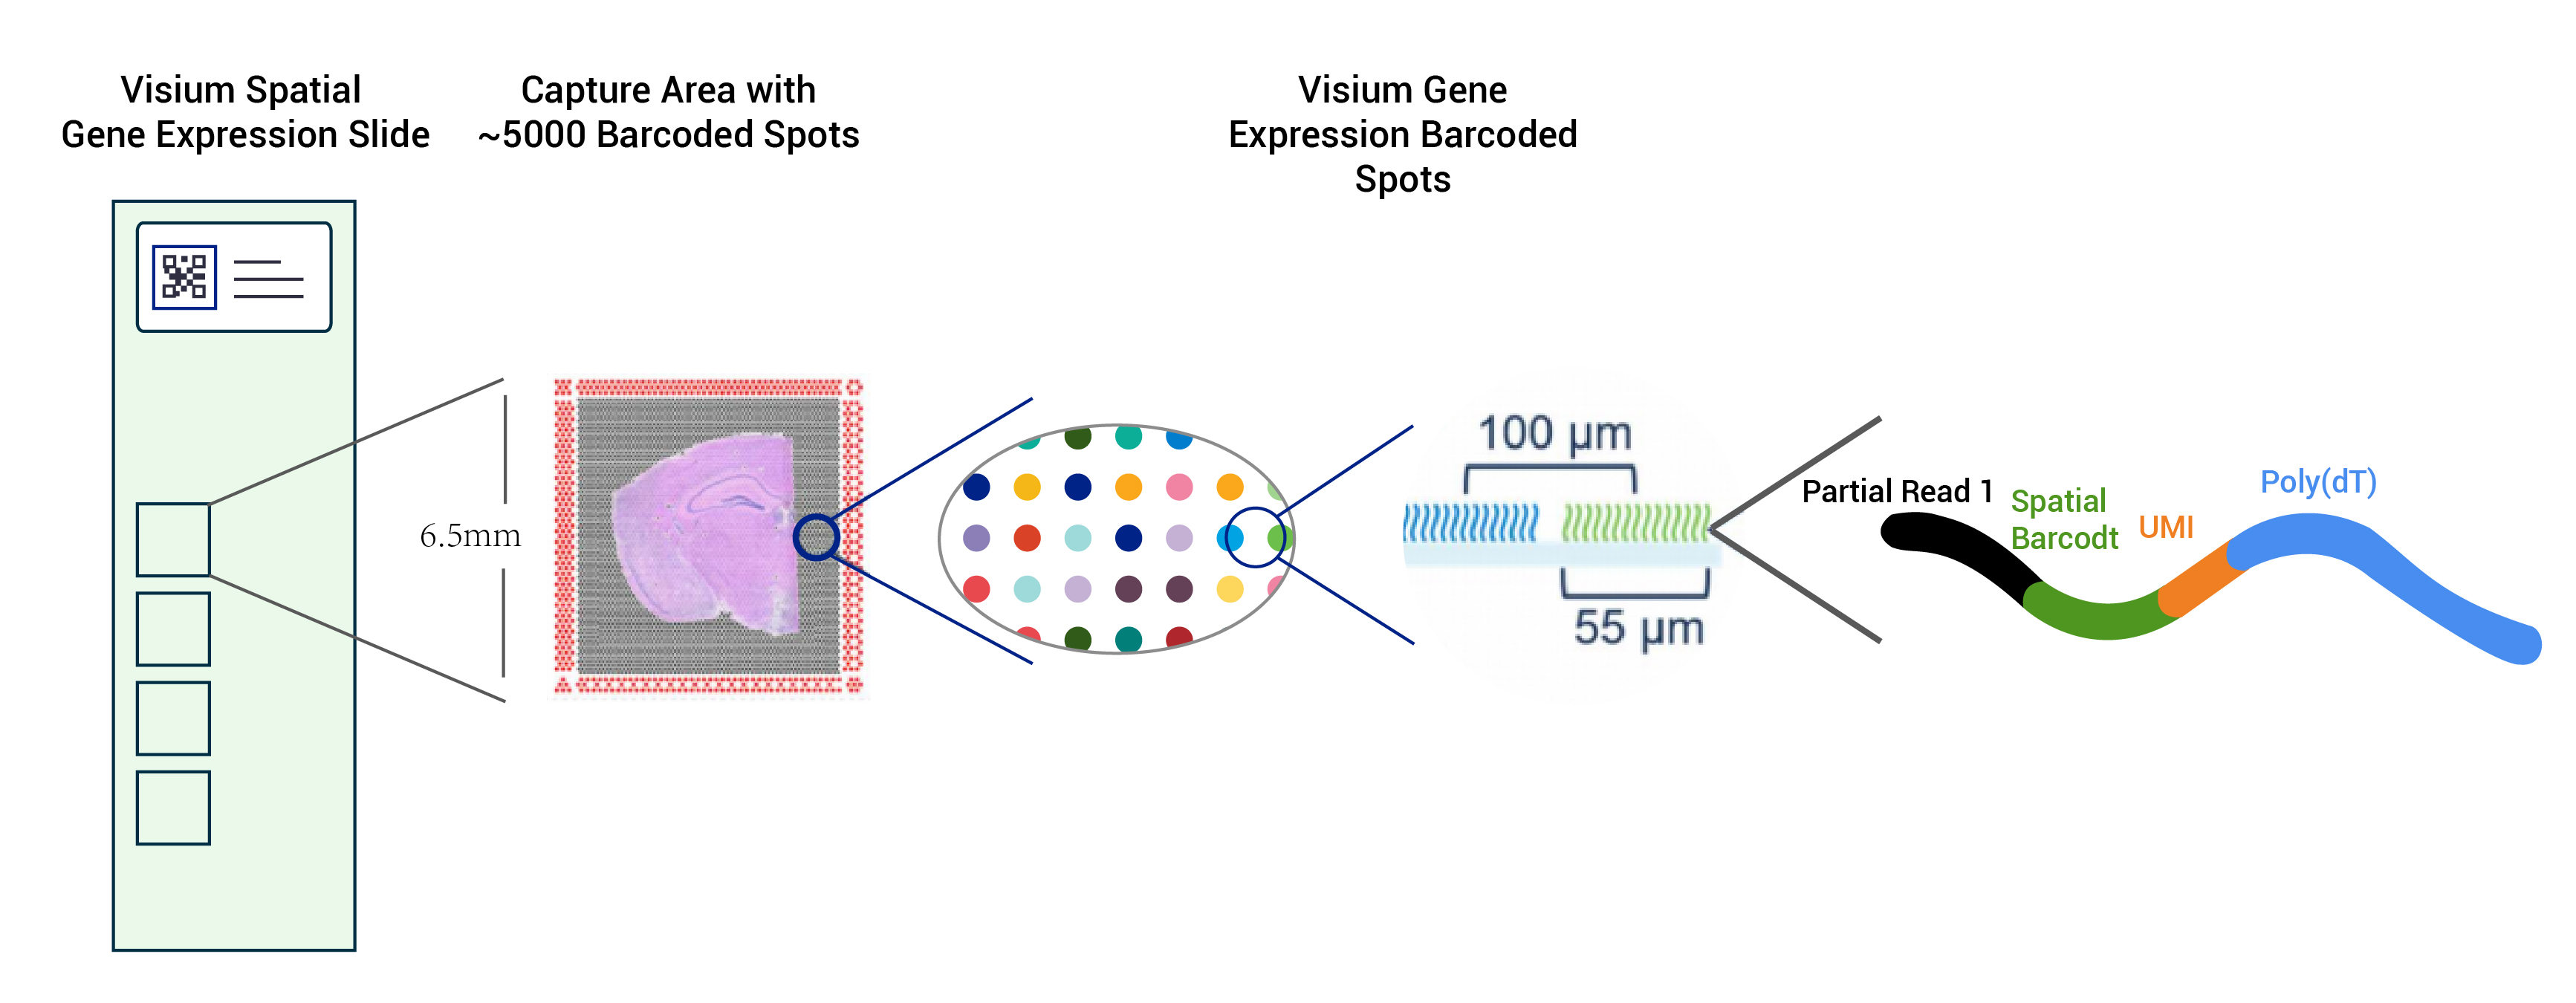
10x Genomics Visium Spatial Transcriptome

Technical Scheme
Features
● Resolution: 100 µM
● Spot Diameter: 55 µM
● Number of spots: 4992
● Capture area: 6.5 x 6.5 mm
● Each barcoded spot is loaded with primers composed of 4 sections:
- poly(dT) tail for mRNA priming and cDNA synthesis
- Unique Molecular Identifier (UMI) to correct amplification bias
- Spatial barcode
- Binding sequence of partial read 1 sequencing primer
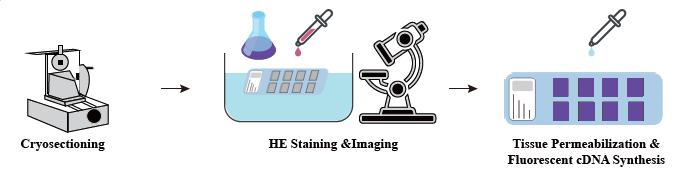
● H&E staining of sections
Advantages
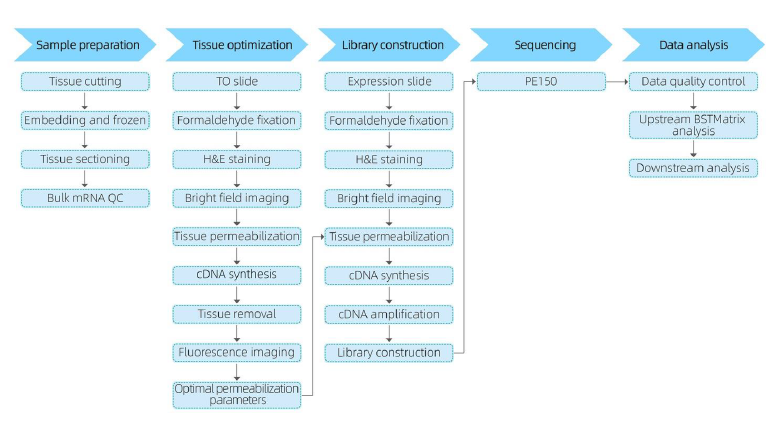
● One-stop service: integrates all experience and skill-based steps, including cryo-sectioning, staining, tissue optimization, spatial barcoding, library preparation, sequencing and bioinformatics .
● Highly skilled technical team: with experience in over 250 tissue types and 100+ species including human, mouse, mammal, fish and plants.
● Real-time update on the entire project: with full control of experimental progress.
● Comprehensive standard bioinformatics: package includes 29 analyses and 100+ high-quality figures.
● Customized data analysis and visualization: available for different research requests.
● Optional joint analysis with Single-cell mRNA sequencing
Specifications
|
Sample Requirements |
Library |
Sequencing strategy |
Data recommended |
Quality Control |
|
OCT-embedded cryo samples, FFPE samples (Optimal diameter: approx. 6x6x6 mm3) 3 blocks per sample |
10X Visium cDNA library |
Illumina PE150 |
50K PE reads per spot ( 60Gb ) |
RIN>7 |
For more details on sample preparation guidance and service workflow, please feel free to talk to a BMKGENE expert
Service Workflow
In the sample preparation phase, an initial bulk RNA extraction trial is performed to ensure a high-quality RNA can be obtained. In the tissue optimization stage the sections are stained and visualized and the permeabilization conditions for mRNA release from tissue are optimized. The optimized protocol is then applied during library construction, followed by sequencing and data analysis.
The complete service workflow involves real-time updates and client confirmations to maintain a responsive feedback loop, ensuring smooth project execution.
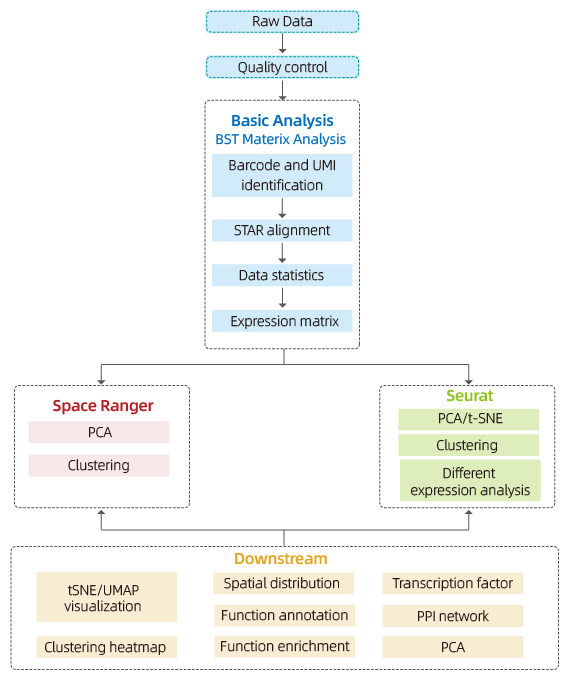
Includes the following analysis:
Data Quality Control:
o Data output and quality score distribution
o Gene detection per spot
o Tissue coverage
Inner-sample analysis:
o Gene richness
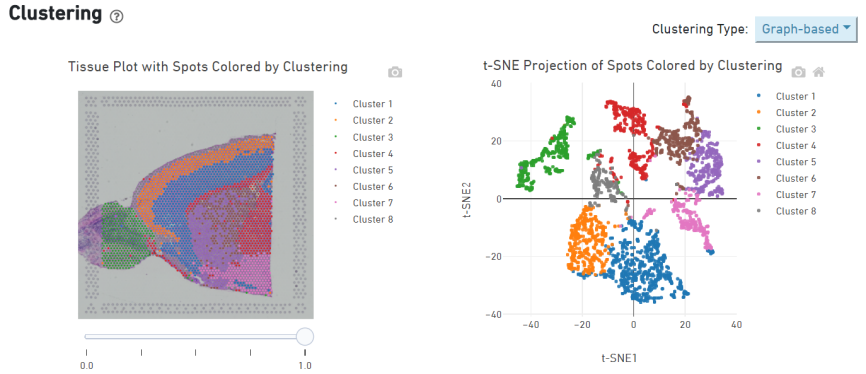
o Spot clustering, including reduced dimension analysis
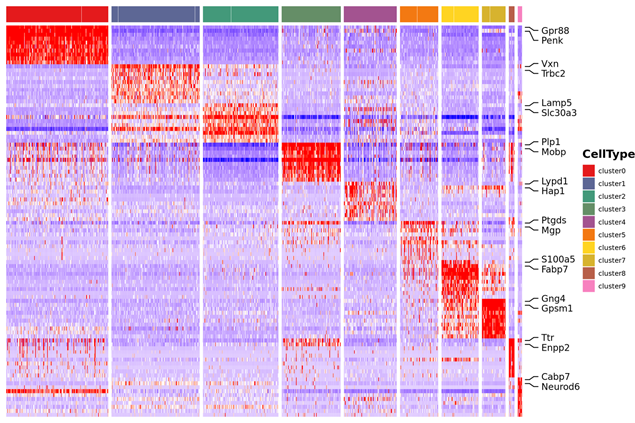
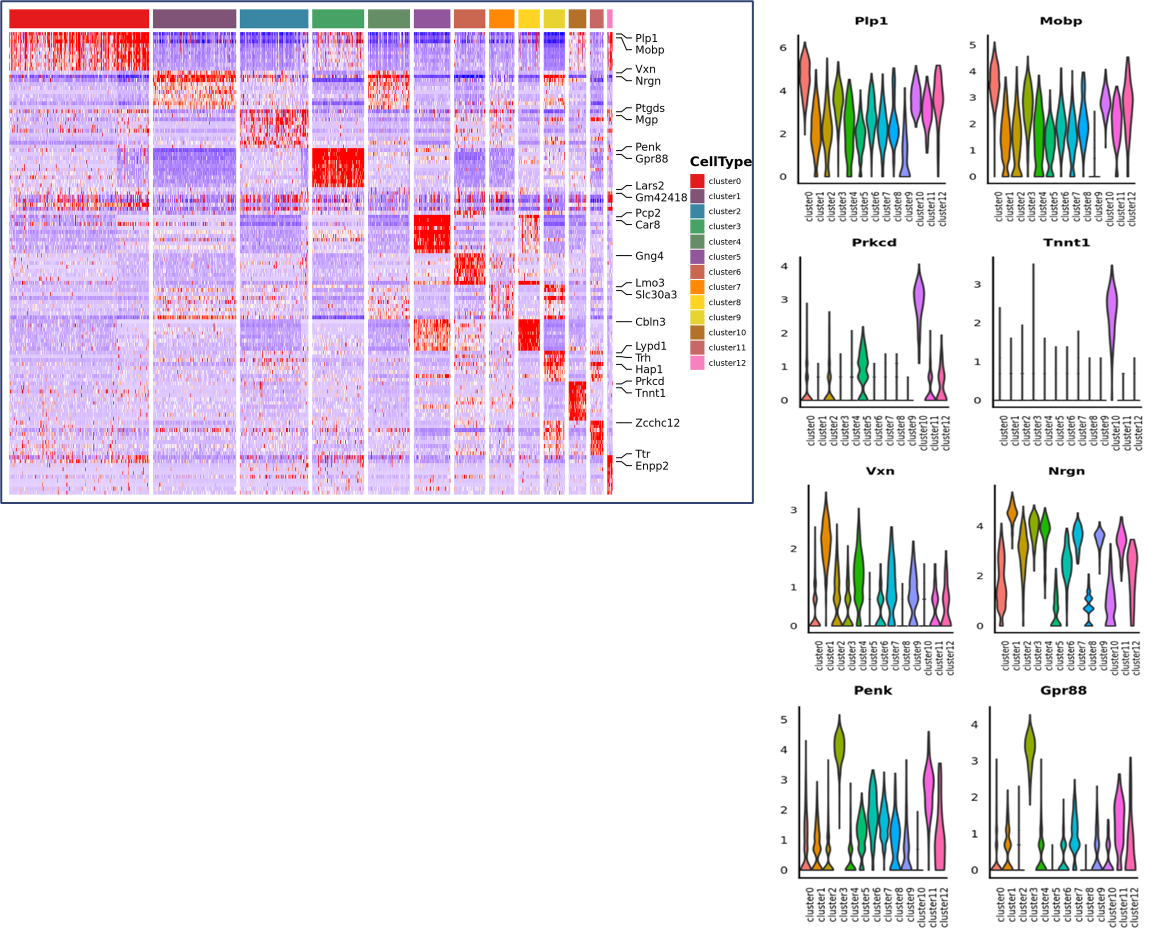
o Differential expression analysis between clusters: identification of marker genes
o Functional annotation and enrichment of marker genes
Inter-group analysis
o Re-combination of spots from both samples (eg. diseased and control) and re-cluster
o Identification of marker genes for each cluster
o Functional annotation and enrichment of marker genes
o Differential Expression of the same cluster between groups
Inner-sample Analysis
Spot clustering
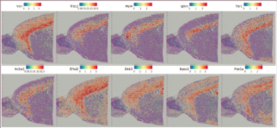
Marker genes identification and spatial distribution
Inter-group Analysis
Data combination from both groups and re-cluster
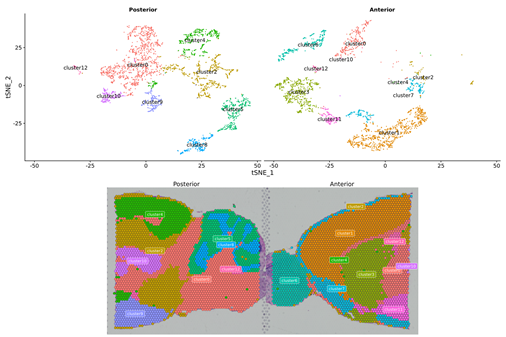
Marker genes of new clusters
Explore the advancements facilitated by BMKGene’s spatial transcriptomics service by 10X Visium In these featured publications:
Chen, D. et al. (2023) ‘mthl1, a potential Drosophila homologue of mammalian adhesion GPCRs, is involved in antitumor reactions to injected oncogenic cells in flies’, Proceedings of the National Academy of Sciences of the United States of America, 120(30), p. e2303462120. doi: /10.1073/pnas.2303462120
Chen, Y. et al. (2023) ‘STEEL enables high-resolution delineation of spatiotemporal transcriptomic data’, Briefings in Bioinformatics, 24(2), pp. 1–10. doi: 10.1093/BIB/BBAD068.
Liu, C. et al. (2022) ‘A spatiotemporal atlas of organogenesis in the development of orchid flowers’, Nucleic Acids Research, 50(17), pp. 9724–9737. doi: 10.1093/NAR/GKAC773.
Wang, J. et al. (2023) ‘Integrating Spatial Transcriptomics and Single-nucleus RNA Sequencing Reveals the Potential Therapeutic Strategies for Uterine Leiomyoma’, International Journal of Biological Sciences, 19(8), pp. 2515–2530. doi: 10.7150/IJBS.83510.