
Non-Reference based mRNA Sequencing-Illumina


Features
● Capture of poly mRNA before library preparation
● Independent of any reference genome: based on de novo assembly of transcripts, generating a list of unigenes that are annotated with multiple databases (NR, Swiss-Prot, COG, KOG, eggNOG, Pfam, GO, KEGG)
● Comprehensive bioinformatic analysis of gene expression and transcript structure
Service Advantages
● Extensive Expertise: with a track record of processing over 200,000 samples at BMK, spanning diverse sample types such as cell cultures, tissues, and body fluids, our team brings a wealth of experience to every project. We've successfully closed over 10,000 mRNA-Seq projects in various research domains.
● Rigorous Quality Control: we implement core control points across all stages, from sample and library preparation to sequencing and bioinformatics. This meticulous monitoring ensures the delivery of consistently high-quality results.
● Comprehensive Annotation: we use multiple databases to functionally annotate the Differentially Expressed Genes (DEGs) and perform the corresponding enrichment analysis, providing insights on the cellular and molecular processes underlying the transcriptome response.
● Post-Sales Support: our commitment extends beyond project completion with a 3-month after-sale service period. During this time, we offer project follow-up, troubleshooting assistance, and Q&A sessions to address any queries related to the results.
Sample Requirements and Delivery
|
Library |
Sequencing strategy |
Data recommended |
Quality Control |
|
Poly A enriched |
Illumina PE150 |
6-10 Gb |
Q30≥85% |
Sample Requirements:
Nucleotides:
|
Conc.(ng/μl) |
Amount (μg) |
Purity |
Integrity |
|
≥ 20 |
≥ 0.5 |
OD260/280=1.7-2.5 OD260/230=0.5-2.5 Limited or no protein or DNA contamination shown on gel. |
For plants: RIN≥6.0; For animals: RIN≥6.5; 5.0≥28S/18S≥1.0; limited or no baseline elevation |
● Plants:
Root, Stem or Petal: 450 mg
Leaf or Seed: 300 mg
Fruit: 1.2 g
● Animal:
HEart or Intestine: 300 mg
Viscera or Brain: 240 mg
Muscle: 450 mg
Bones, Hair or Skin: 1g
● Arthropods:
Insects: 6g
Crustacea: 300 mg
● Whole blood: 1 tube
● Cells: 106 cells
Recommended Sample Delivery
Container:
2 ml centrifuge tube (Tin foil is not recommended)
Sample labeling: Group+replicate e.g. A1, A2, A3; B1, B2, B3.
Shipment:
Dry-ice: Samples need to be packed in bags and buried in dry-ice.
RNAstable tubes: RNA samples can be dried in RNA stabilization tube(e.g. RNAstable®) and shipped in room temperature.
Service Work Flow

Experiment design
Sample delivery
RNA extraction
Library construction
Sequencing
Data analysis

After-sale services
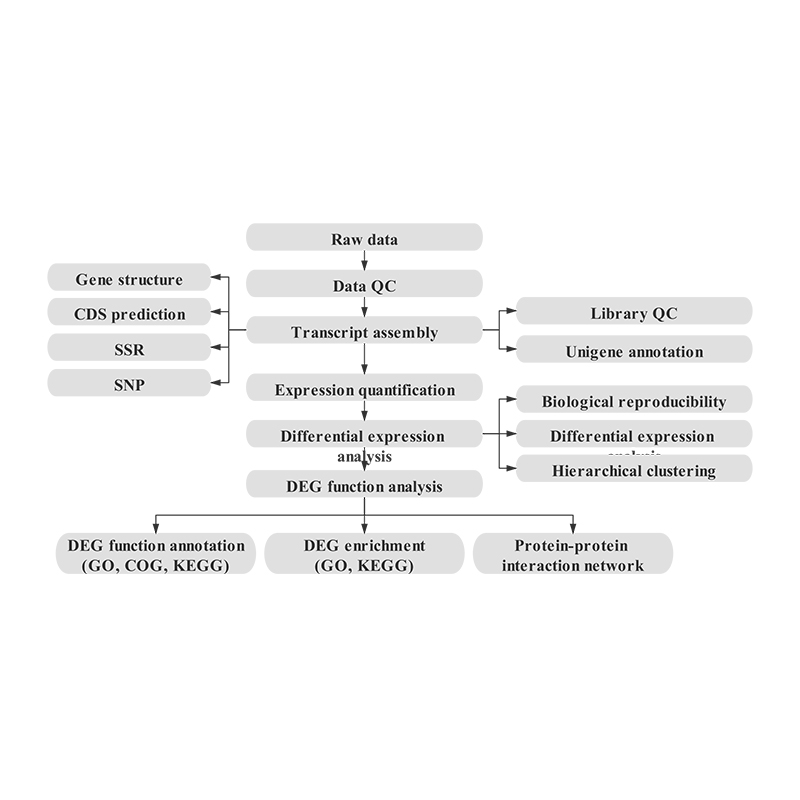
Bioinformatics
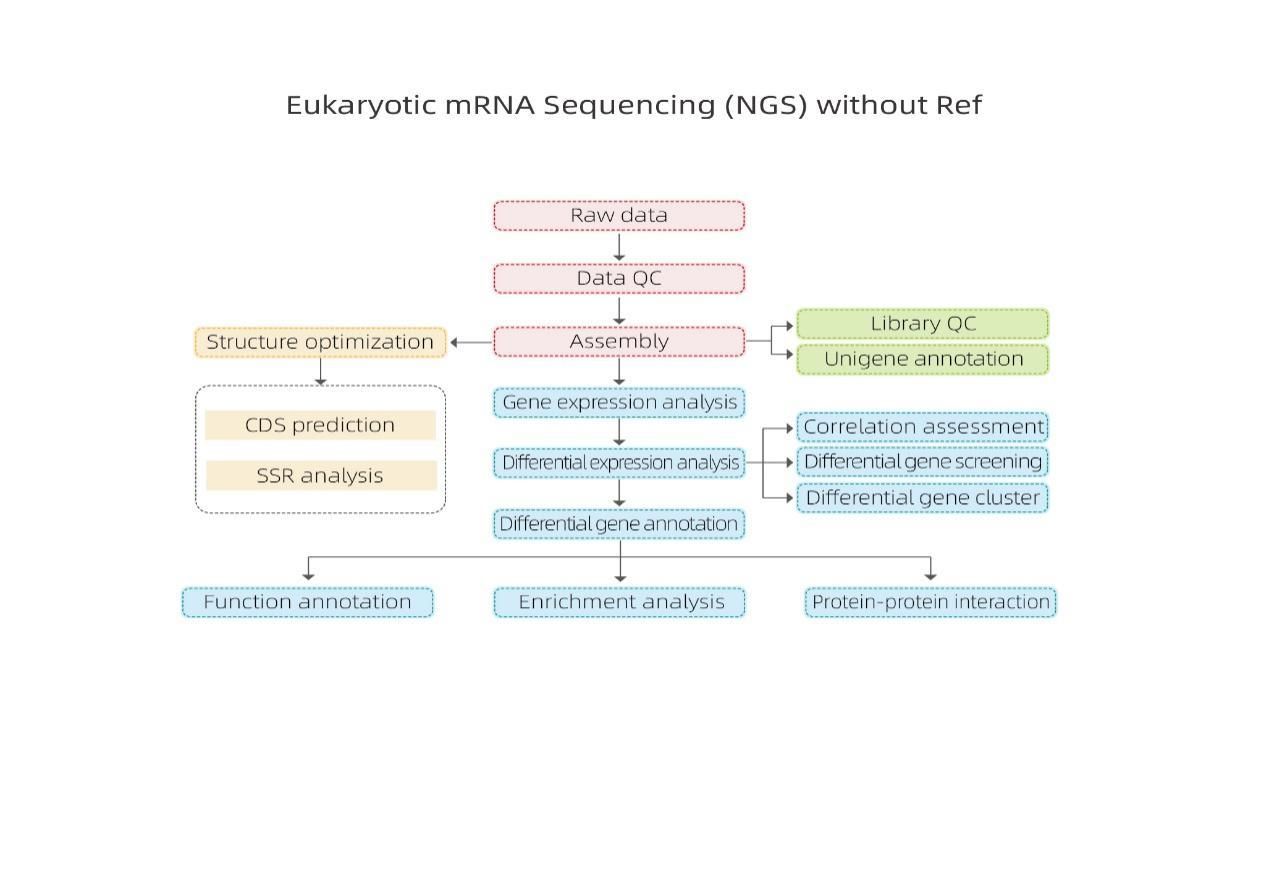
Transcriptome assembly and unigene selection

Unigene annotation

Sample correlation and assessment of biological replicates

Differentially Expressed Genes (DEGs)

Functional Annotation of DEGs

Functional Enrichment of DEGs

Explore the advancements facilitated by BMKGene’s eukaryotic NGS mRNA sequencing services through a curated collection of publications.
Shen, F. et al. (2020) ‘De novo transcriptome assembly and sex-biased gene expression in the gonads of Amur catfish (Silurus asotus)’, Genomics, 112(3), pp. 2603–2614. doi: 10.1016/J.YGENO.2020.01.026.
Zhang, C. et al. (2016) ‘Transcriptome analysis of sucrose metabolism during bulb swelling and development in onion (Allium cepa L.)’, Frontiers in Plant Science, 7(September), p. 212763. doi: 10.3389/FPLS.2016.01425/BIBTEX.
Zhu, C. et al. (2017) ‘De novo assembly, characterization and annotation for the transcriptome of Sarcocheilichthys sinensis’, PLoS ONE, 12(2). doi: 10.1371/JOURNAL.PONE.0171966.
Zou, L. et al. (2021) ‘De novo transcriptome analysis provides insights into the salt tolerance of Podocarpus macrophyllus under salinity stress’, BMC Plant Biology, 21(1), pp. 1–17. doi: 10.1186/S12870-021-03274-1/FIGURES/9.