
Small RNA sequencing-Illumina
Features
● Library preparation includes a size selection step
● Bioinformatic analysis centered around miRNA prediction and their targets
Service Advantages
● Comprehensive bioinformatics analysis: enabling the identification of both known and novel miRNAs, identification of miRNAs targets, and corresponding functional annotation and enrichment with multiple databases (KEGG, GO)
● Rigorous Quality Control: we implement core control points across all stages, from sample and library preparation to sequencing and bioinformatics. This meticulous monitoring ensures the delivery of consistently high-quality results.
● Post-Sales Support: Our commitment extends beyond project completion with a 3-month after-sale service period. During this time, we offer project follow-up, troubleshooting assistance, and Q&A sessions to address any queries related to the results.
● Extensive Expertise: with a track record of successfully closing over multiple sRNA projects covering over 100 species in various research domains, our team brings a wealth of experience to every project.
Sample Requirements and Delivery
|
Library |
Platform |
Recommended data |
Data QC |
|
Size selected |
Illumina SE50 |
10M-20M reads |
Q30≥85% |
Sample Requirements:
Nucleotides:
|
Conc.(ng/μl) |
Amount (μg) |
Purity |
Integrity |
|
≥ 80 |
≥ 0.5 |
OD260/280=1.7-2.5 OD260/230=0.5-2.5 Limited or no protein or DNA contamination shown on gel. |
RIN≥6.5; 5.0≥28S/18S≥1.0; limited or no baseline elevation |
● Plants:
Root, Stem or Petal: 450 mg
Leaf or Seed: 300 mg
Fruit: 1.2 g
● Animal:
Heart or Intestine: 450 mg
Viscera or Brain: 240 mg
Muscle: 600 mg
Bones, Hair or Skin: 1.5g
● Arthropods:
Insects: 9g
Crustacea: 450 mg
● Whole blood: 2 tubes
● Cells: 106 cells
● Serum and Plasma: 6 mL
Recommended Sample Delivery
Container:
2 ml centrifuge tube (Tin foil is not recommended)
Sample labeling: Group+replicate e.g. A1, A2, A3; B1, B2, B3.
Shipment:
1.Dry-ice: Samples need to be packed in bags and buried in dry-ice.
2.RNAstable tubes: RNA samples can be dried in RNA stabilization tube(e.g. RNAstable®) and shipped in room temperature.
Service Work Flow

Experiment design
Sample delivery

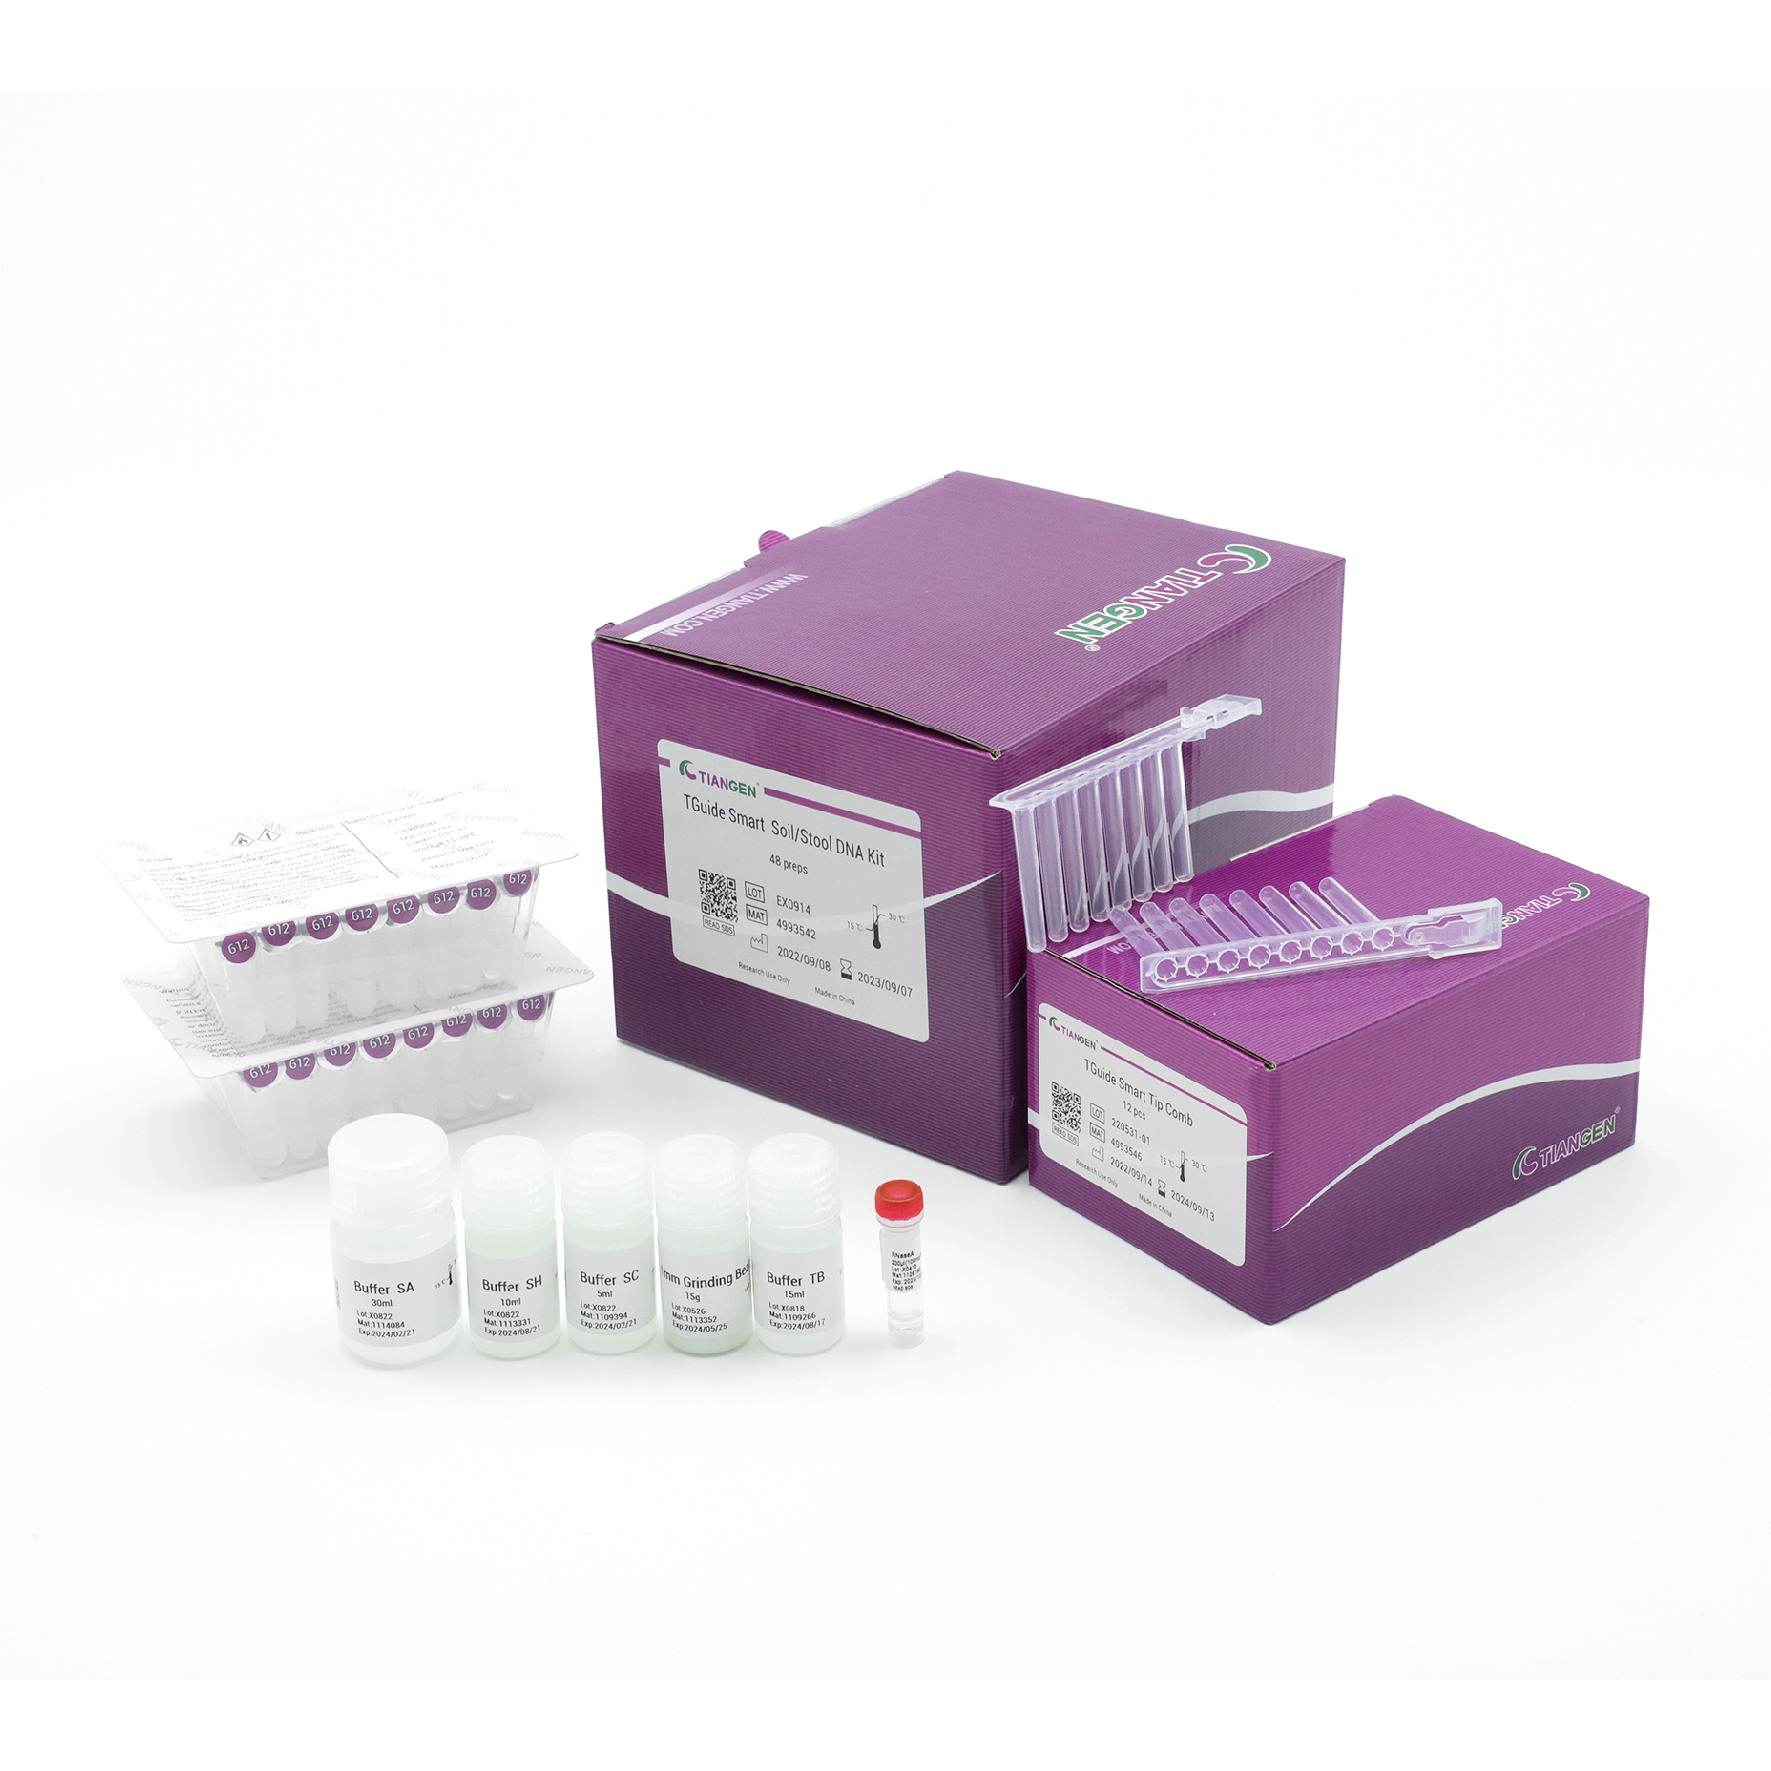
RNA extraction
Library construction

Sequencing
Data analysis

After-sale services
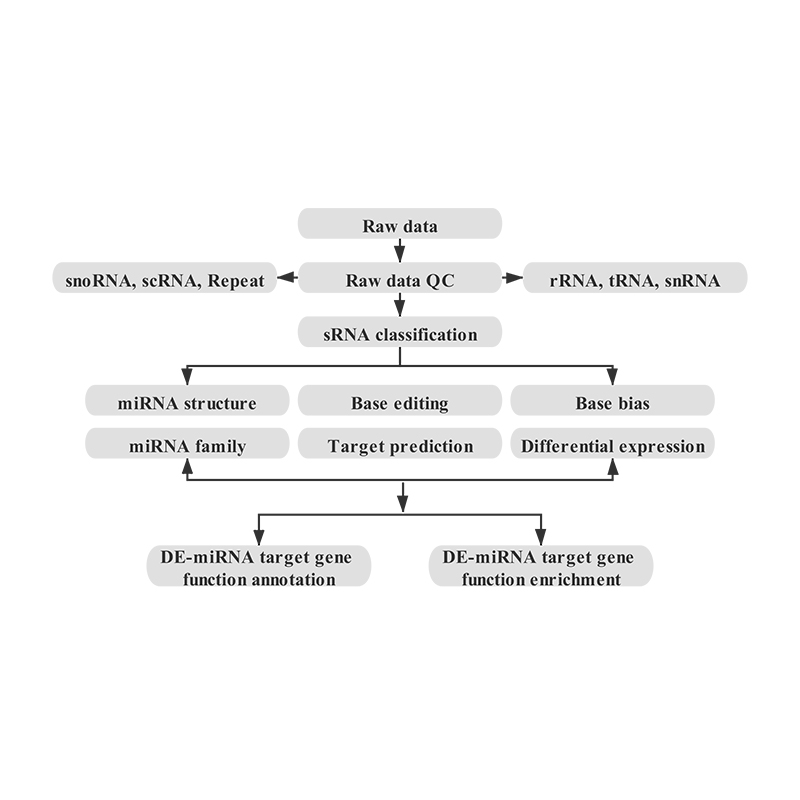
Bioinformatics
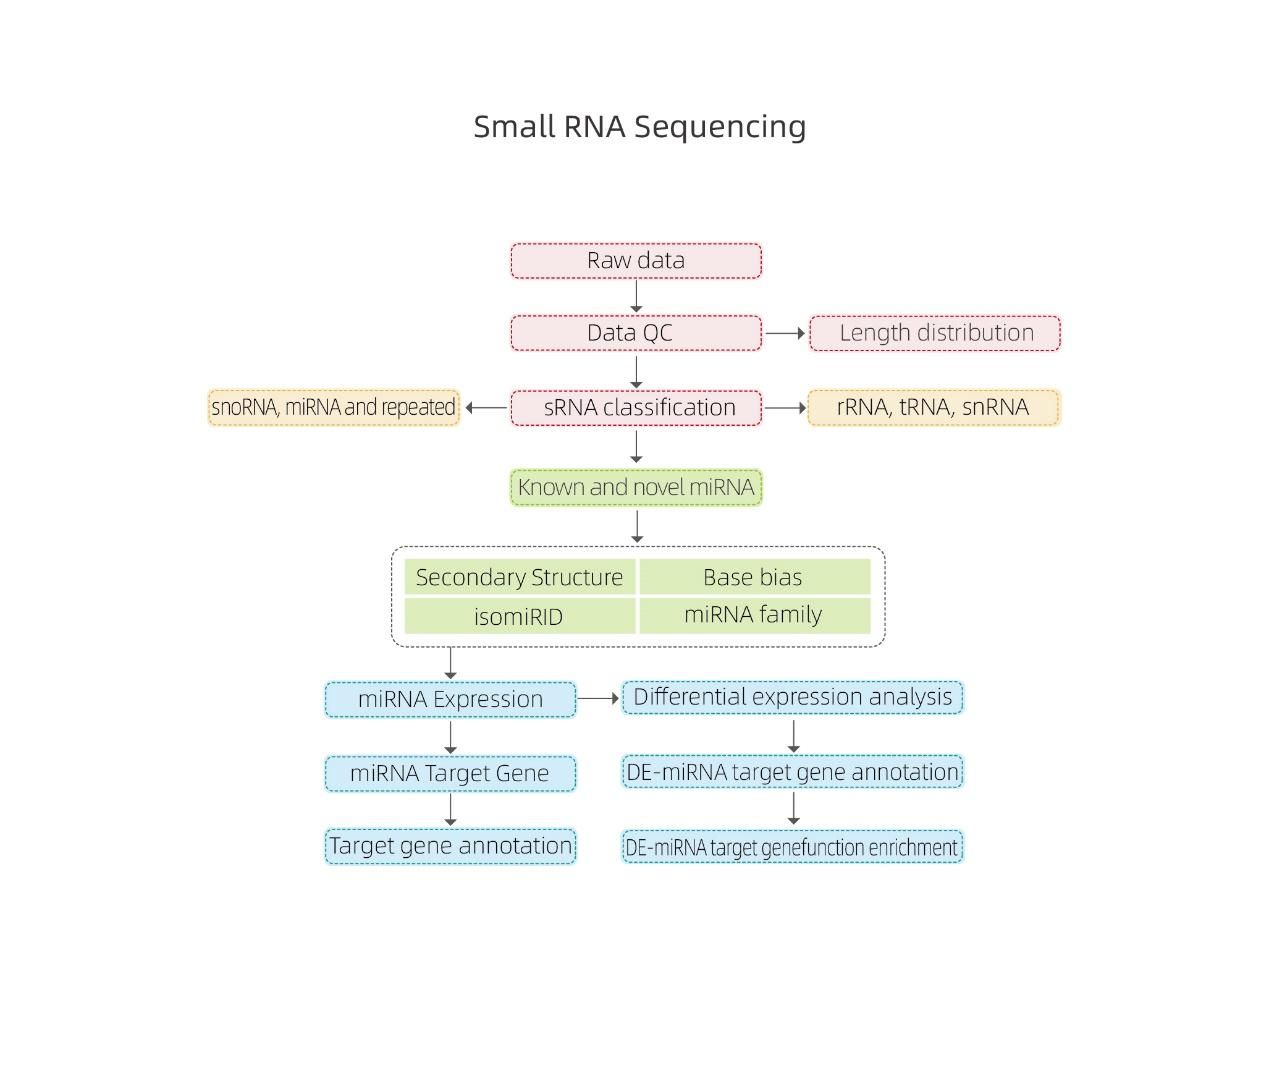 ● Raw data quality control
● sRNA classification
● Alignment to a reference genome
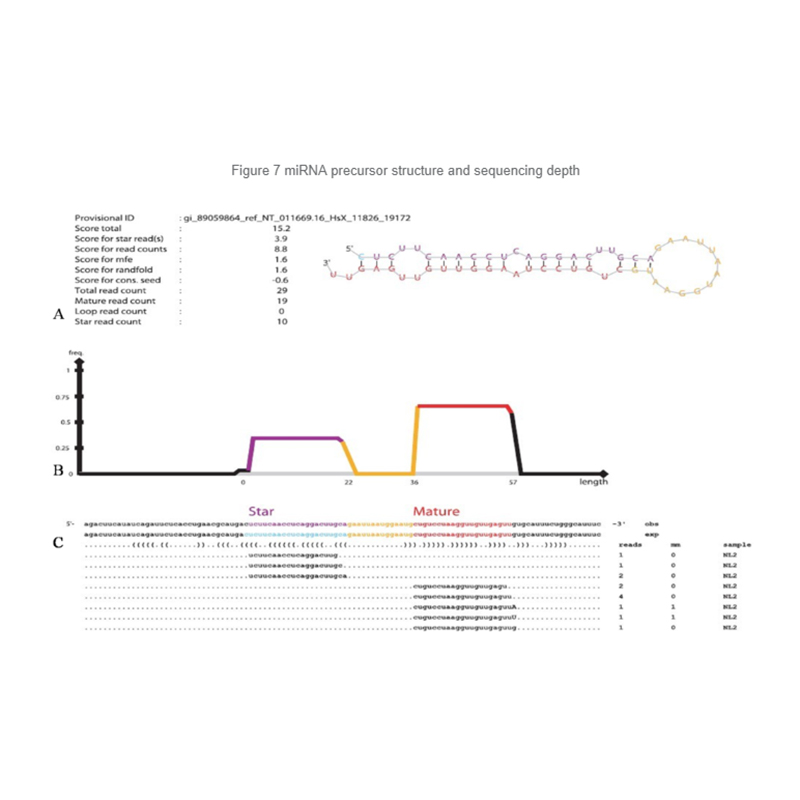
● Identification of known and novel miRNA
● Differential miRNA expression analysis
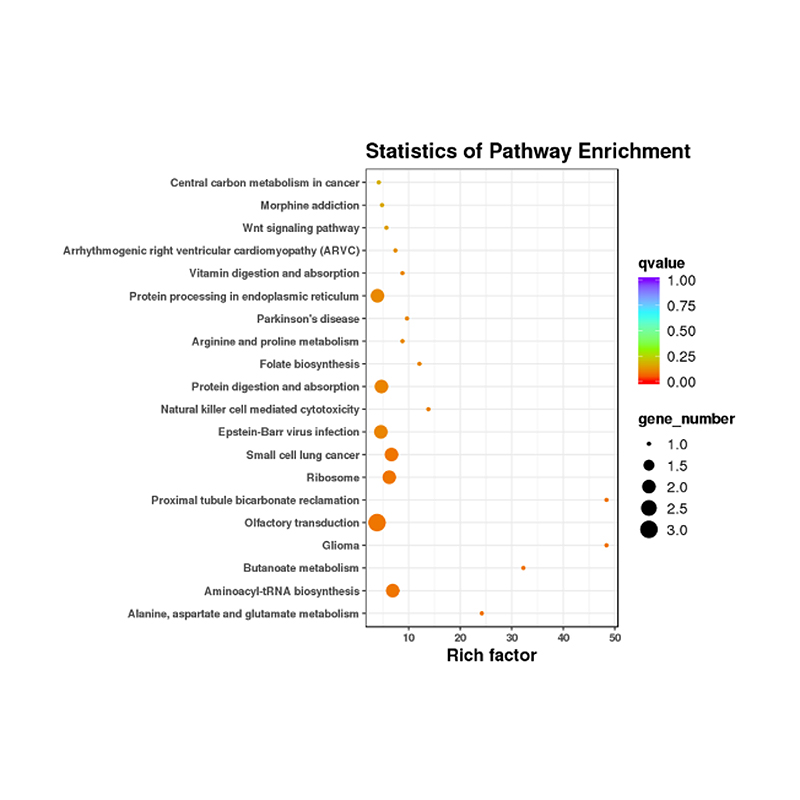
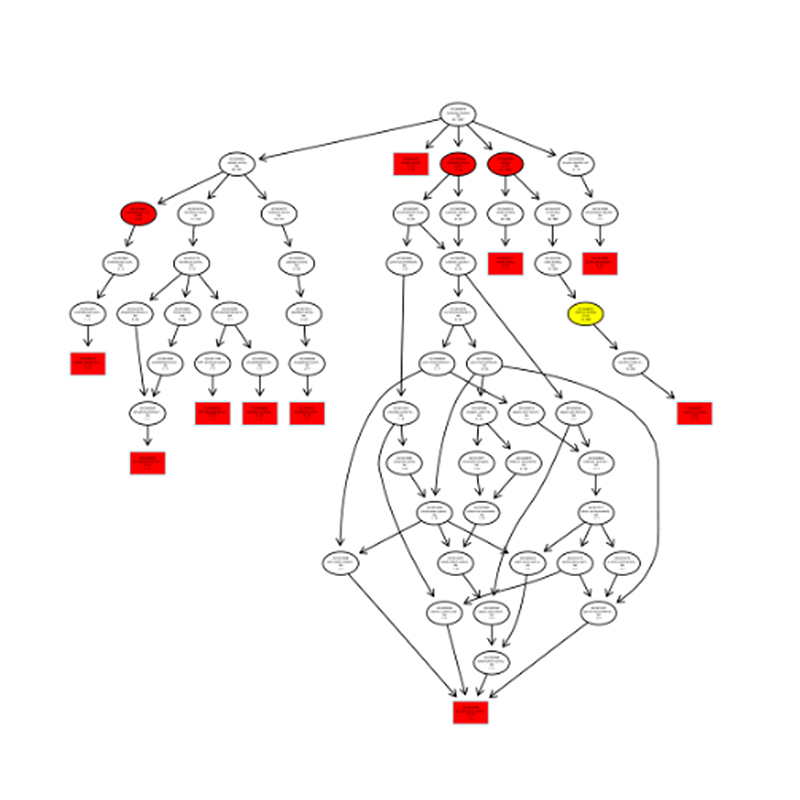
● Functional annotation of miRNA targets
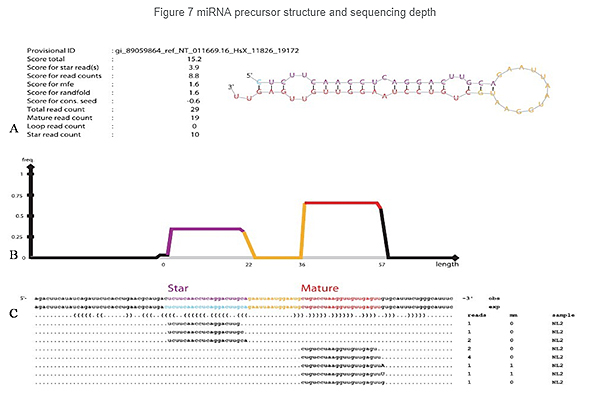
Identification of miRNA: structure and depth
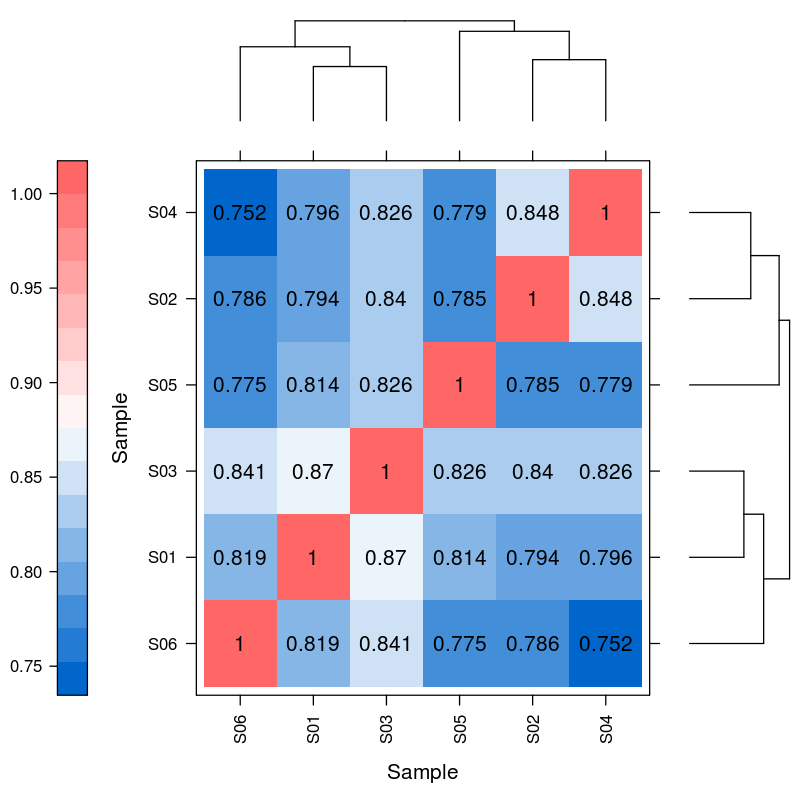
Differential expression of miRNA – hiearchical clustering
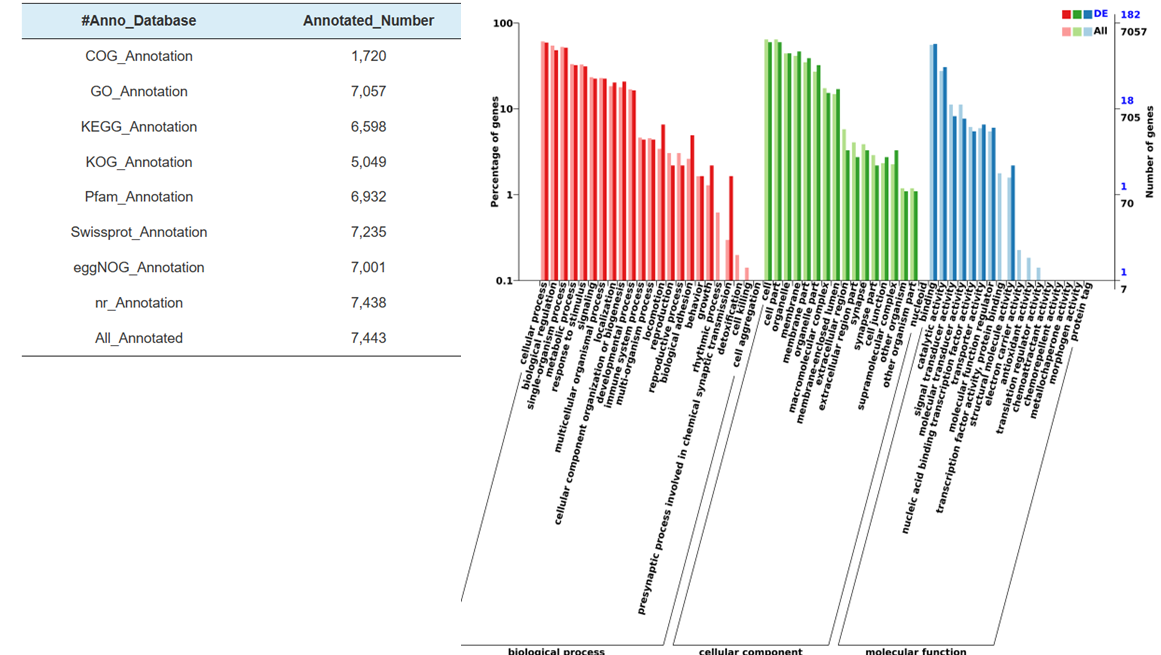
Functional annotation of target of differentially expressed miRNAs
Explore the research advancements facilitated by BMKGene’ sRNA sequencing services through a curated collection of publications.
Chen, H. et al. (2023) ‘Viral infections inhibit saponin biosynthesis and photosynthesis in Panax notoginseng’, Plant Physiology and Biochemistry, 203, p. 108038. doi: 10.1016/J.PLAPHY.2023.108038.
Li, H. et al. (2023) ‘ The plant FYVE domain‐containing protein FREE1 associates with microprocessor components to repress miRNA biogenesis ’, EMBO reports, 24(1). doi: 10.15252/EMBR.202255037/SUPPL_FILE/EMBR202255037-SUP-0004-SDATAFIG4.TIF.
Yu, J. et al. (2023) ‘The MicroRNA Ame-Bantam-3p Controls Larval Pupal Development by Targeting the Multiple Epidermal Growth Factor-like Domains 8 Gene (megf8) in the Honeybee, Apis mellifera’, International Journal of Molecular Sciences, 24(6), p. 5726. doi: 10.3390/IJMS24065726/S1.
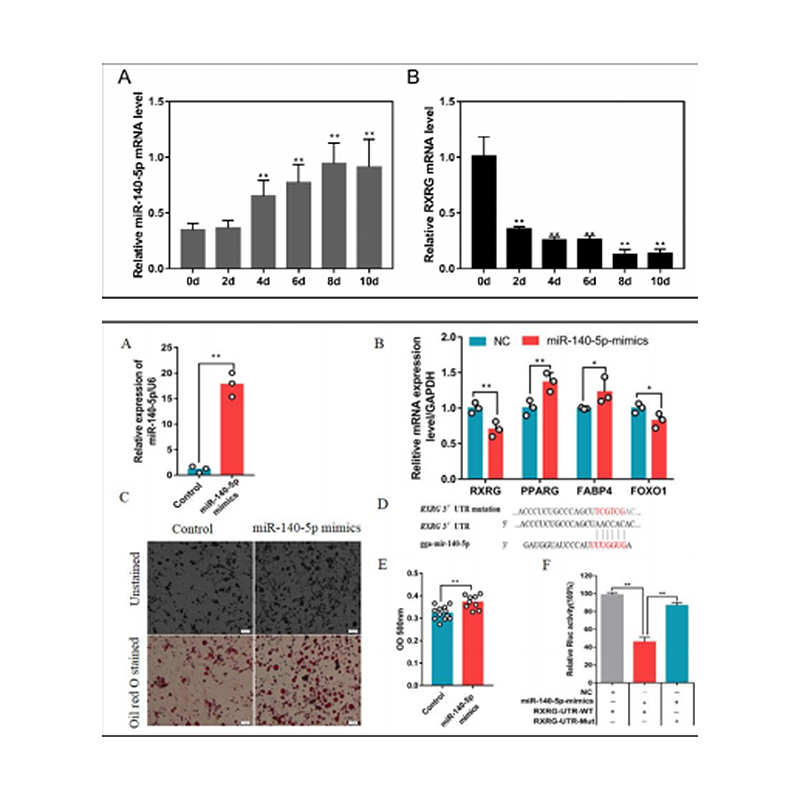
Zhang, M. et al. (2018) ‘Integrated Analysis of MiRNA and Genes Associated with Meat Quality Reveals that Gga-MiR-140-5p Affects Intramuscular Fat Deposition in Chickens’, Cellular Physiology and Biochemistry, 46(6), pp. 2421–2433. doi: 10.1159/000489649.